In vocational schools, grading and evaluation rules differ significantly from high schools. As a computer skill instructor at a vocational school, I encountered numerous challenges in recording grades and tracking student progress.
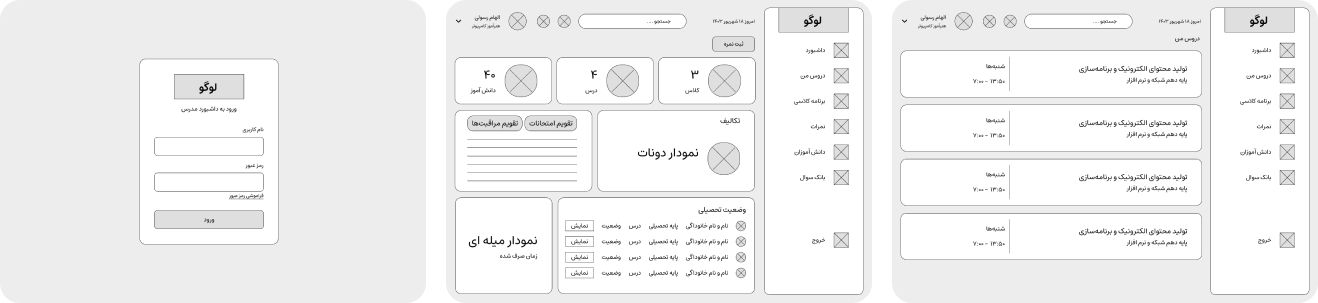
Instructors used to record students’ marks in paper grade sheets which had limited space to keep track of every activity. To address this need, I decided to design a class management dashboard. I used the Design Thinking framework in this project to create a user-centered and effective solution.
Building on my own experience as an instructor, I conducted interviews with fellow educators to gain deeper insights into their needs and challenges. Many expressed frustration over the limited tools available for efficient and accurate grading, as well as for maintaining student records. Drawing from these insights, I developed a comprehensive User Experience Map that captures the core issues and explores potential solutions, ensuring that the design truly addresses the day-to-day realities instructors face.
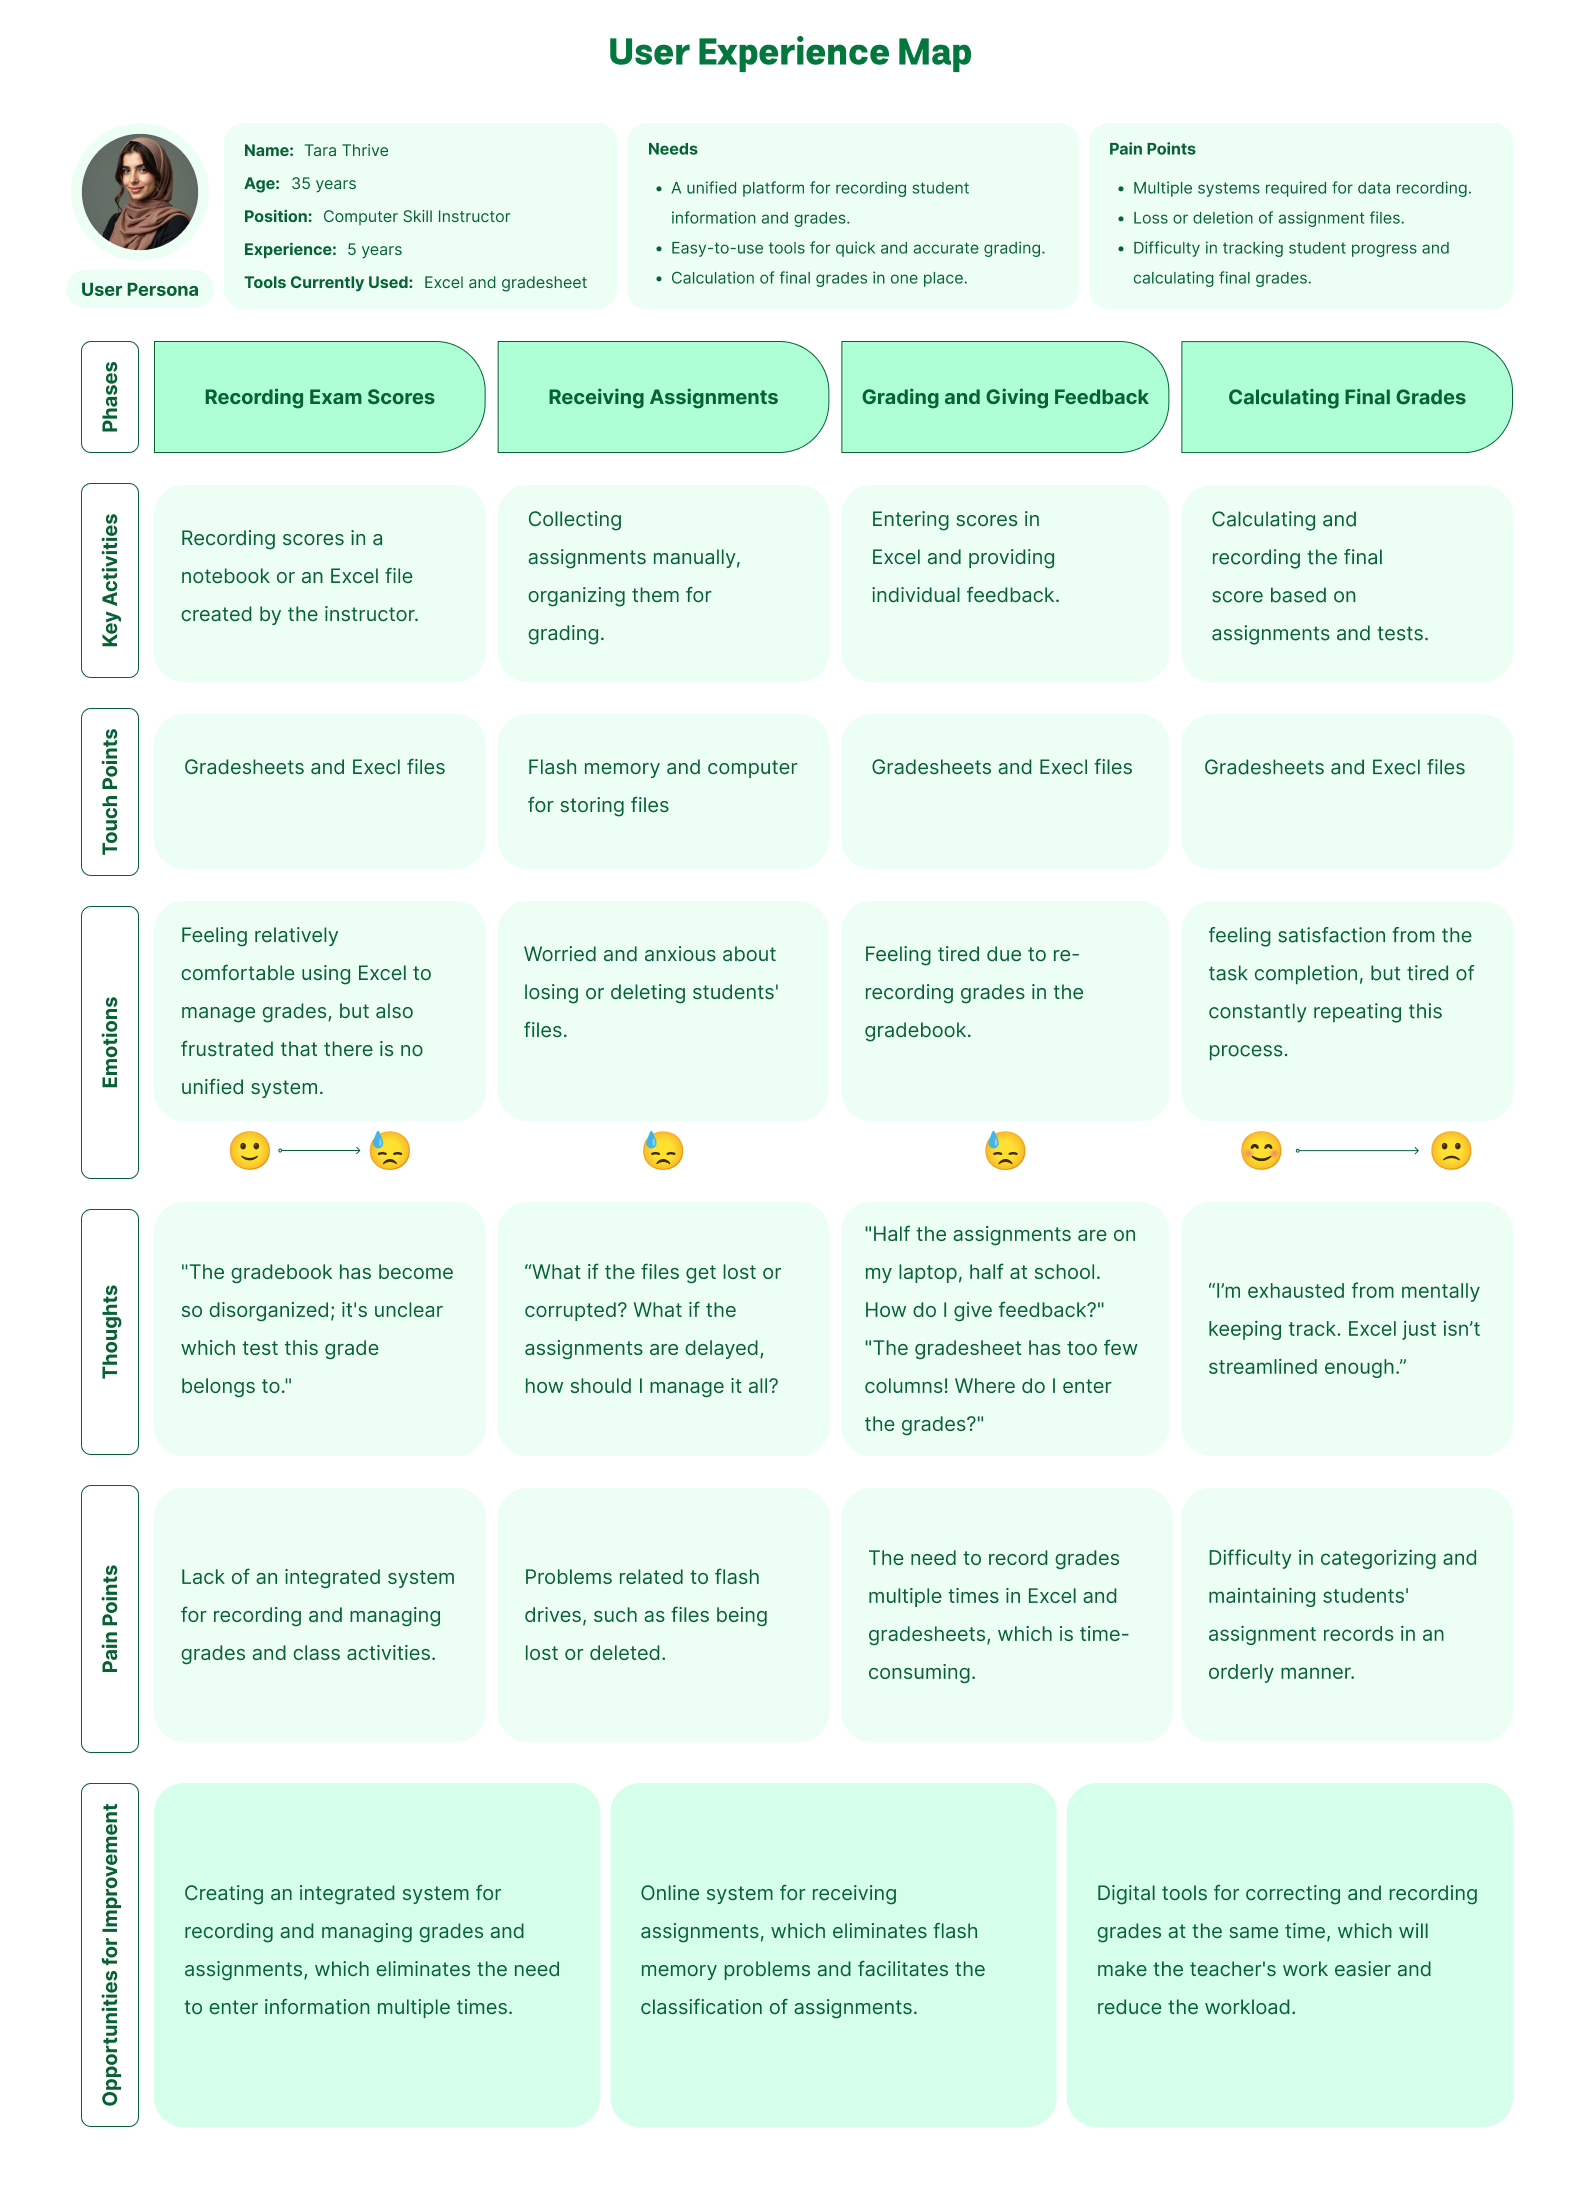
I found that instructors faced challenges with disorganized gradebooks and inconsistent access to assignments, turning the task of tracking students' progress into a draining and demotivating experience.
The physical grade sheets are not designed efficiently, there's not enough space for recording all test scores and assignments.
Relying on flash drives for assignments is risky—files can easily vanish or be accidentally erased.
Instructors needed a classroom management dashboard that not only streamlines daily tasks like grading and providing feedback but also delivers a smooth, stress-free, and enjoyable experience.
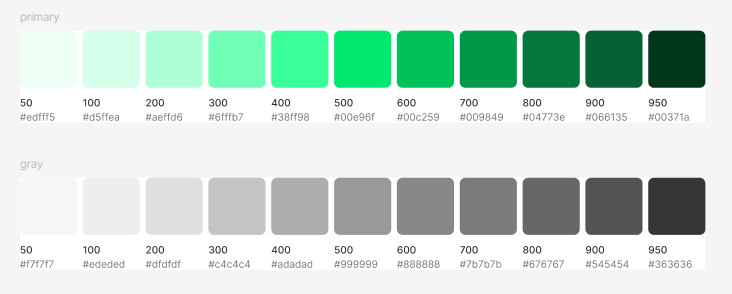
I chose green as the primary color to reflect growth and the spirit of learning.
 I also designed the logo myself. It's a logotype meaning class.
![]()
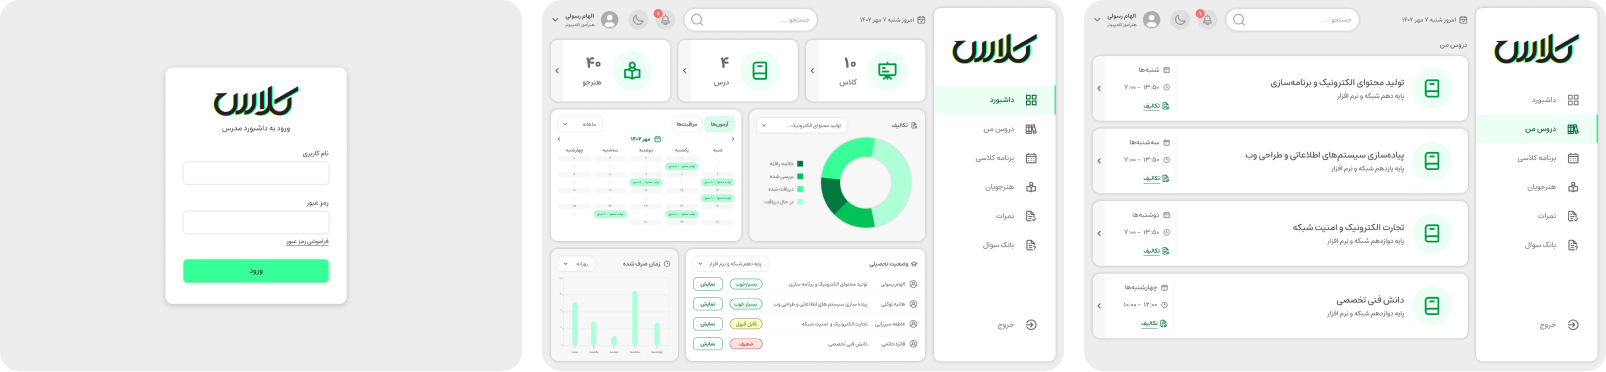
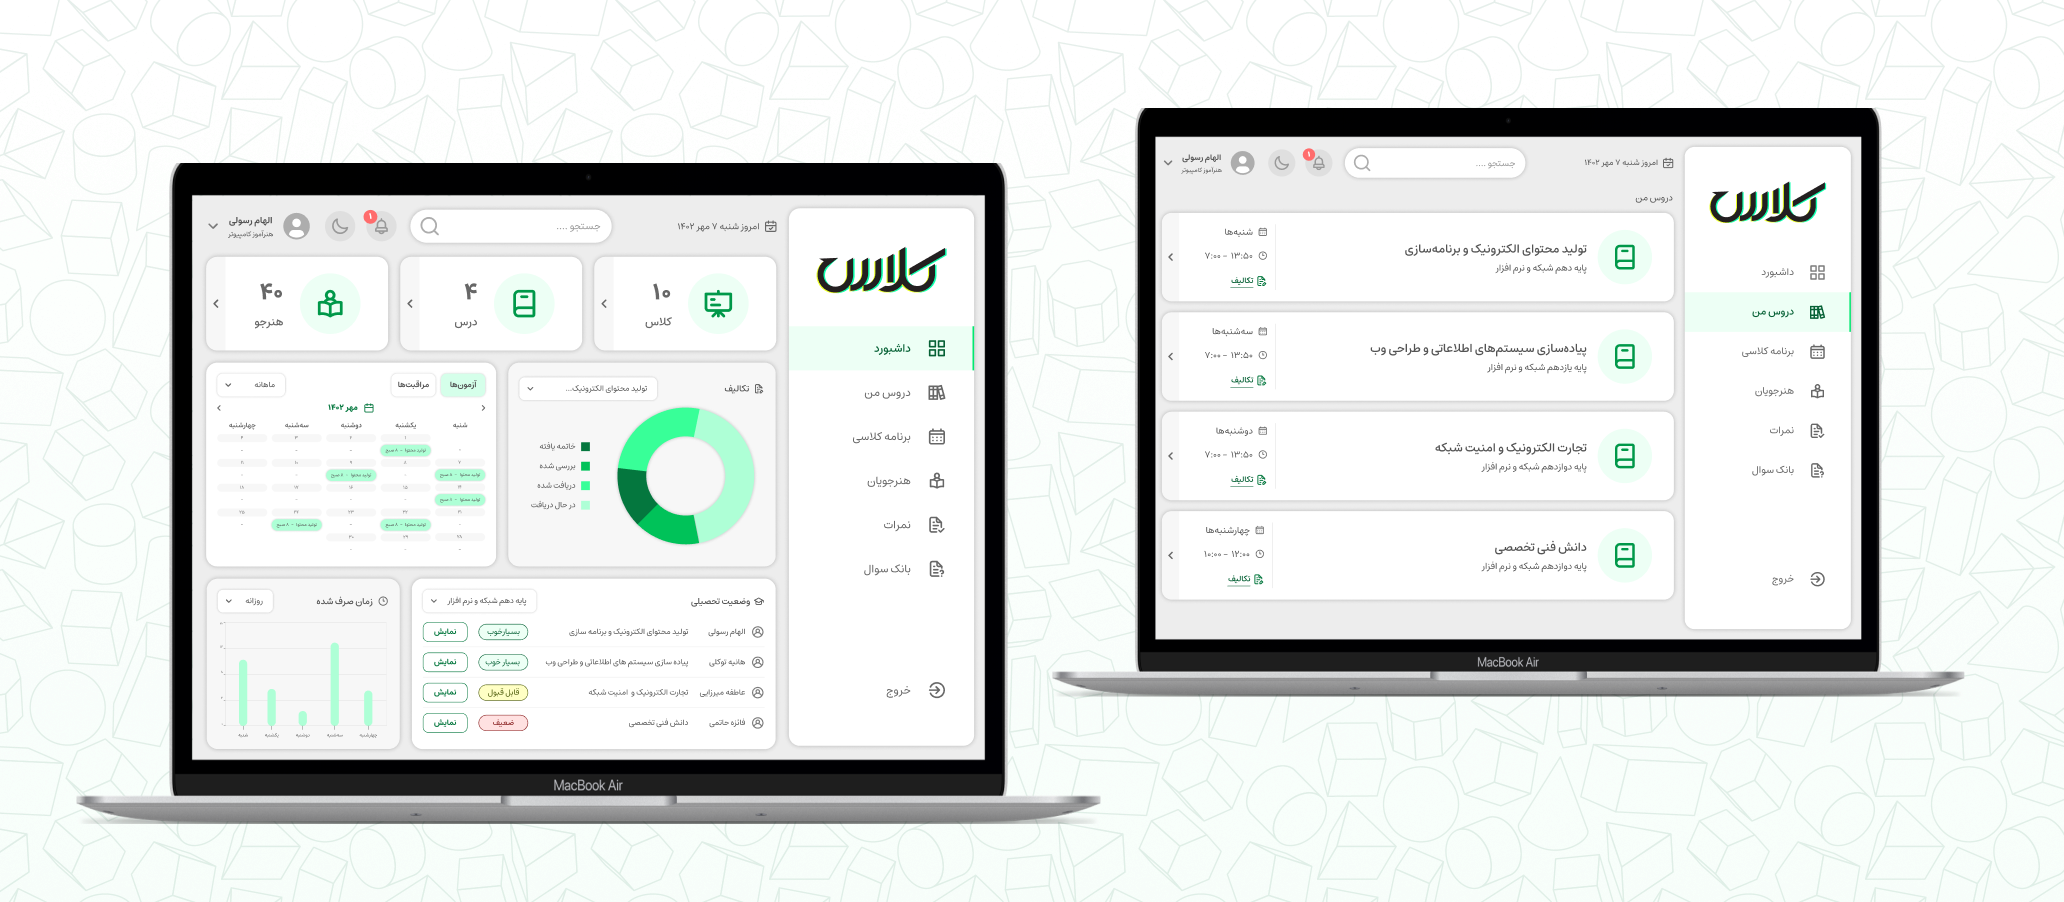
The new teacher dashboard has transformed the way instructors manage their classrooms, making daily tasks more efficient and organized.
A Clear Overview of Student Progress: The dashboard provides a comprehensive view of each student’s performance, helping teachers quickly identify who needs attention and who’s excelling. This clear snapshot makes it easier to tailor support and track progress effectively.
Streamlined Grading and Feedback: With built-in tools for grading and feedback, teachers can save time on repetitive tasks and focus on providing personalized, meaningful feedback. This efficiency boosts productivity and allows more time for student interaction.
Real-Time Insights for Better Teaching: The dashboard offers real-time data, giving teachers immediate insights into student performance. This allows for quick adjustments to teaching strategies, ensuring students get the support they need in a timely manner.
Organized and Accessible Data: The system’s ability to keep all grades, assignments, and reminders in one place has eliminated the chaos of disorganized files. Teachers no longer need to worry about misplaced documents or missed deadlines, as everything is neatly organized and accessible.
Direct Communication with Students: The dashboard’s feedback features enable teachers to share progress and areas for improvement with students directly. This fosters a stronger connection and helps students stay motivated and focused on their growth.
Flexible Access Anytime, Anywhere: Whether in class or working remotely, teachers can access the dashboard from any device. This flexibility ensures that managing student progress is never confined to one location or time.
Overall, this design has greatly enhanced the teaching experience, improving efficiency, organization, and communication between teachers and students.
There were so many feature that could be integrated into this dashboard, but I decided to focus on user pain points. So, to evaluate the designed dashboard, Usability Testing was conducted with a group of instructors. Real-life scenarios of daily tasks for instructors were defined. Examples of the defined tasks include:
Entering student grades into the system
Reviewing and recording student assignments
Managing class schedules
Viewing students' academic status
After the testing, the instructors' feedback on their experience using the dashboard was recorded. Here are 2 suggestions extracted from the feedback:
Improvements in the notification system: Some teachers mentioned that the notification system should function more efficiently, with reminders and alerts displayed more quickly, and priorities categorized according to educational needs.
Adding a curriculum system: One of the suggestions from the instructors was to add a feature that would allow them to view the curriculum and lesson plans for each course. This feature could be integrated into the dashboard to help instructors manage educational resources more effectively.